

2020
Metrus Impact Report
Investing in Sustainable Energy as a Service
About This Report
We’re launching this inaugural Impact Report as part of our effort to lead by example. This report tracks the energy savings, CO2 reduction, and efficiency of our investments in terms of CO2 savings per $1,000 invested across our entire portfolio. We believe it is time for industry-wide, consistent reporting on emissions reductions for all Energy as a Service projects and climate-related Environmental, Social, and Governance (ESG) investments.
Download the PDF version of this report for additional data not included below.
Our Mission
We are leading the way to a sustainable, low-carbon future by bringing energy efficiency and clean energy projects to life.
CEO Message

Bob Hinkle
President & CEO
Dear Stakeholders,
At Metrus, we work hard every day to accelerate and scale the transition to a low-carbon, sustainable future with investments in energy efficiency and renewable-energy projects. It is not enough, however, to say we only make climate-positive investments. We must be willing and able to track and report the environmental and financial performance of all Energy as a Service investments and do so in a manner consistent with the Science-Based Targets initiative (SBTi). This integration of environmental performance (carbon reduction) with financial performance enables businesses, schools, and hospitals to decarbonize their operations and track and report on the performance of their projects.
I believe annual reporting of CO2 reductions should be woven into the way the sustainable investment community does business: Climate impact reports increase accountability, standardize offerings, and shine a spotlight on the environmental and financial benefits for customers, partners and communities. This type of reporting can also serve to accelerate the scale and scope of project implementation by attracting the additional private investment required to upgrade and green our country’s buildings and infrastructure.
The information in this report reflects how we screen, value and monitor our investments. Fighting climate change requires time-bound, urgent action and significant capital investment. It also requires standardizing how the Energy as a Service industry operates and how sustainable investments are tracked and reported. Metrus is eager to set this new standard for tracking and reporting on our climate-positive investments — you’ll see it in this report and in the editions that will follow in the years ahead.
Thanks,

Our Portfolio
Metrus has operational Sustainable Energy Services Agreement (SESA) projects in 26 states, encompassing more than 490 sites.1 Our portfolio consists of approximately 30 different types of energy-efficiency measures and technologies.
Energy Efficiency Measures (EEMs) and Technology
Nearly half of our projects feature three or more EEMs, which is consistent with our efforts to bundle upgrades with varying economic and technology profiles to achieve scale. Ninety-seven percent of our projects include lighting, reflecting both its crucial value to customers and its economic importance to unlocking deeper energy retrofits. SESA projects for private sector business, education, and health care customers are all represented in the 8+ category. The 17% of our projects with a single EEM are predominantly for warehouse and distribution center clients.

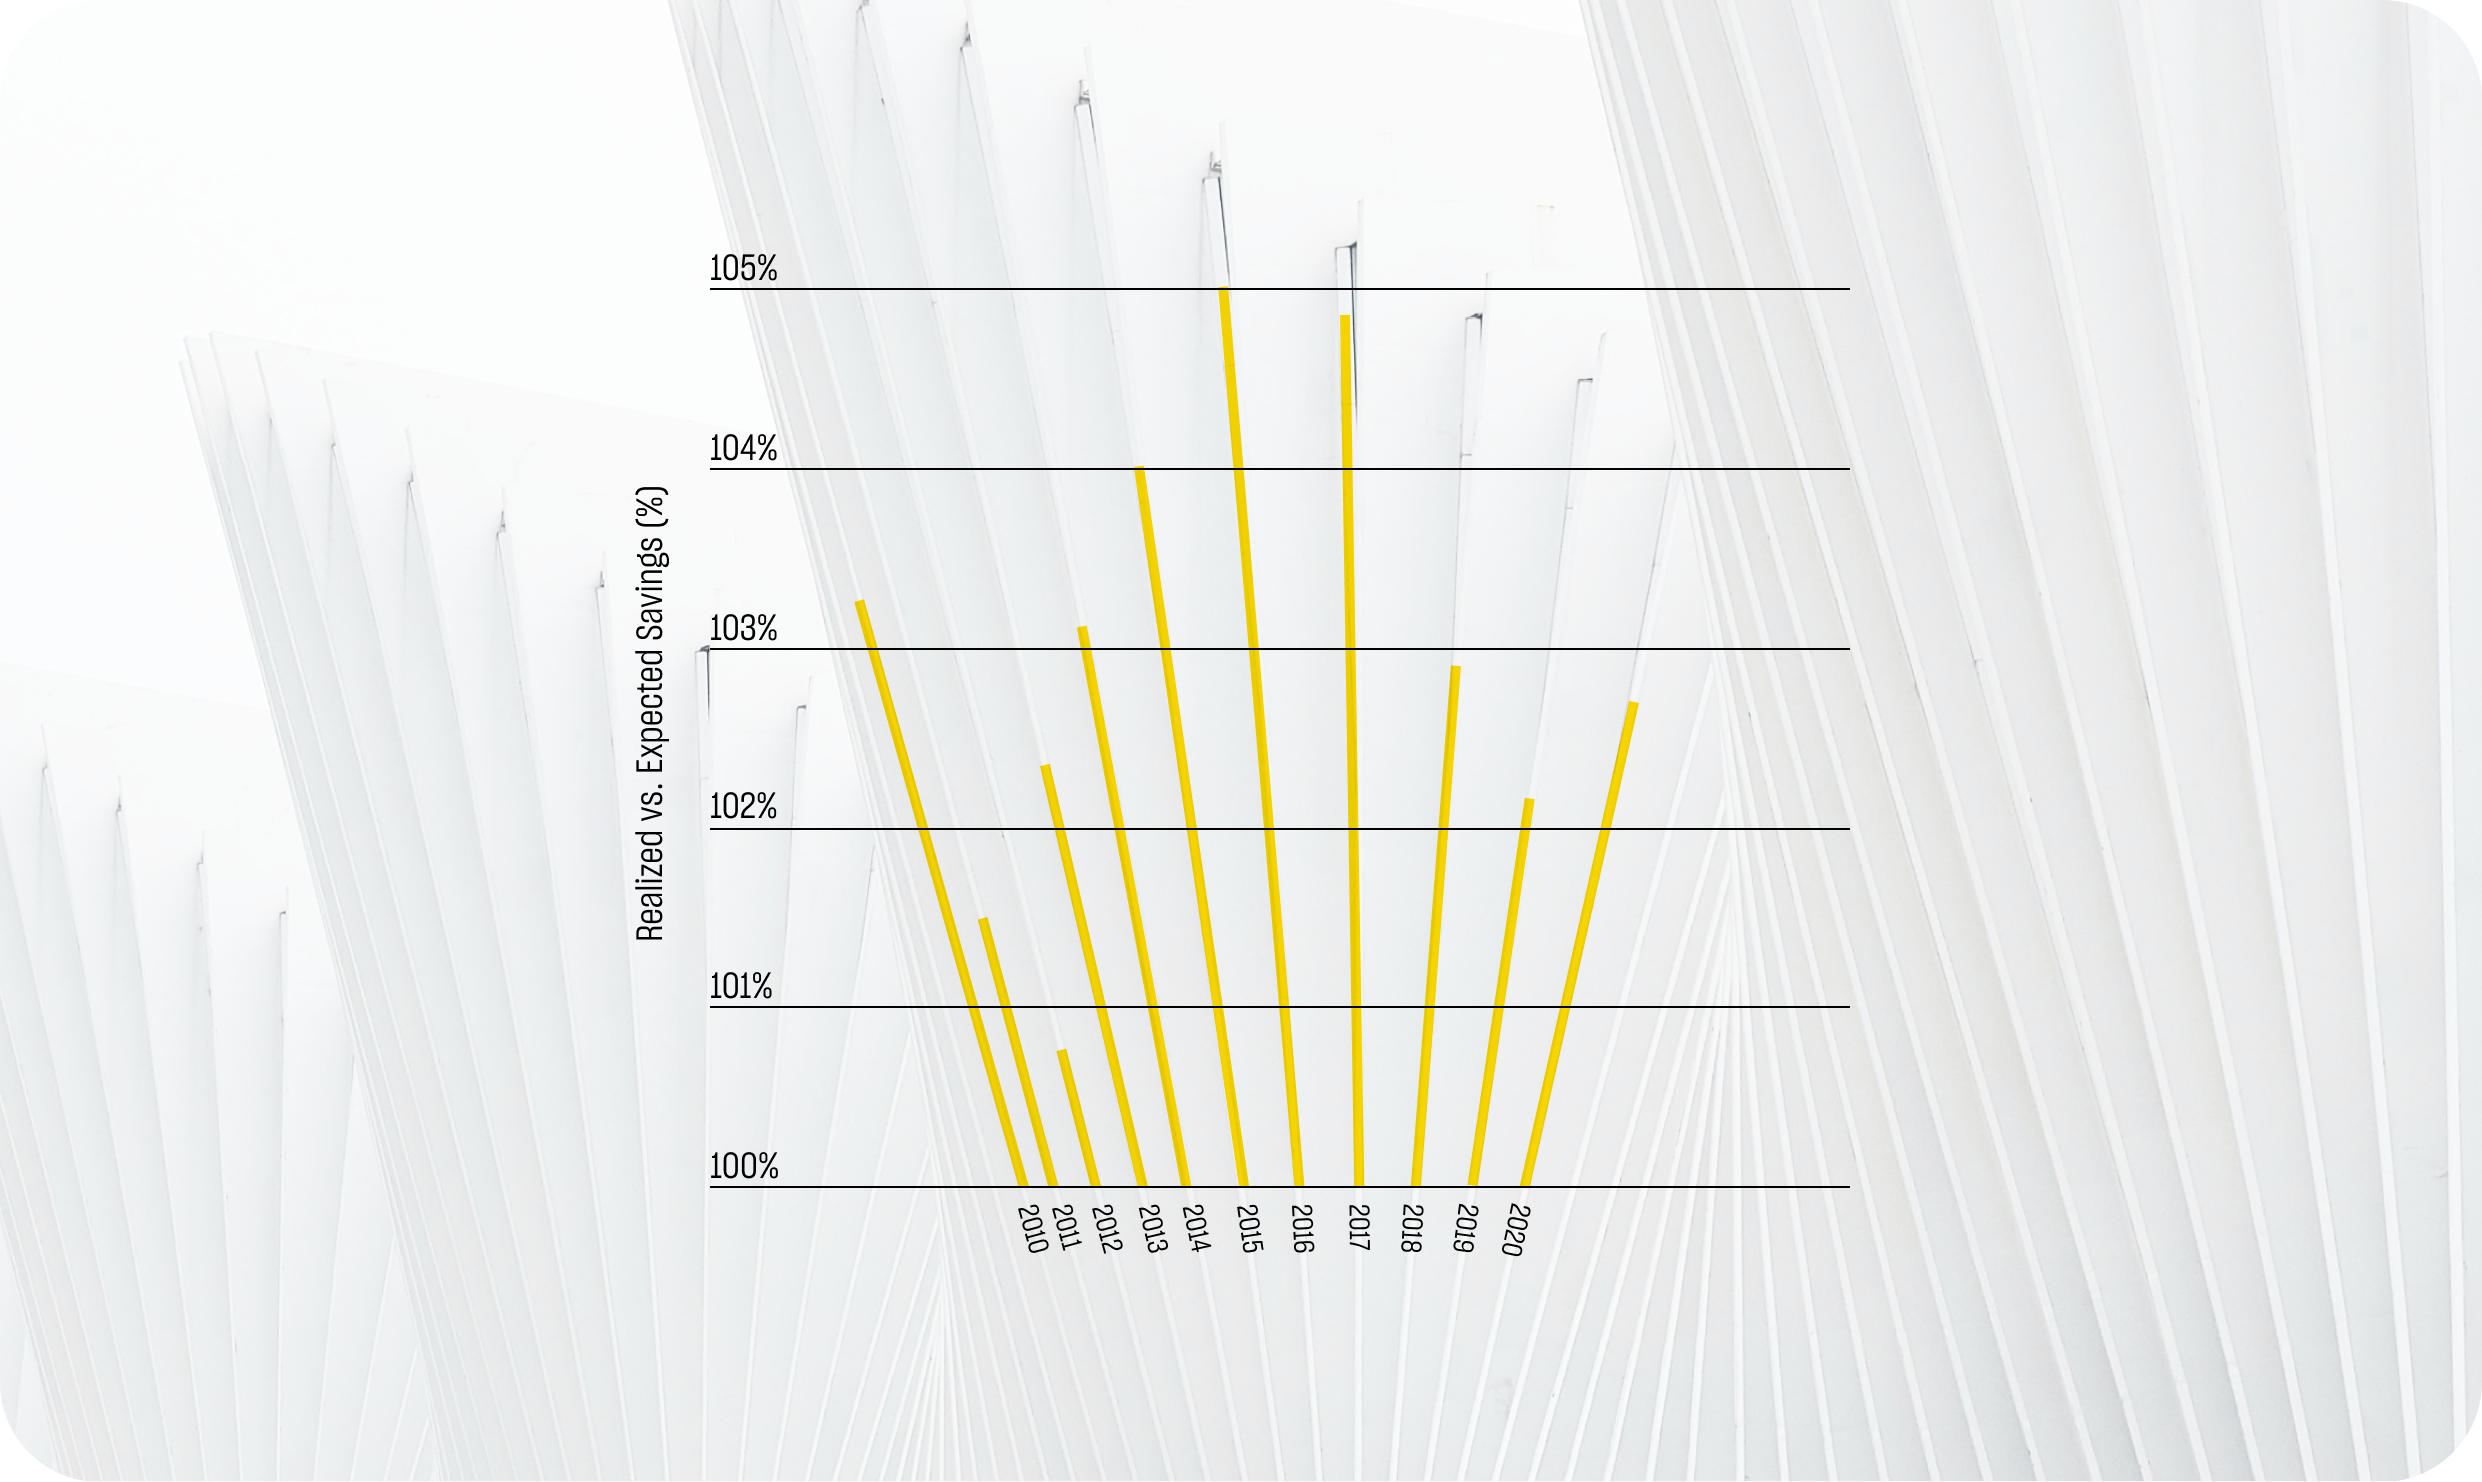
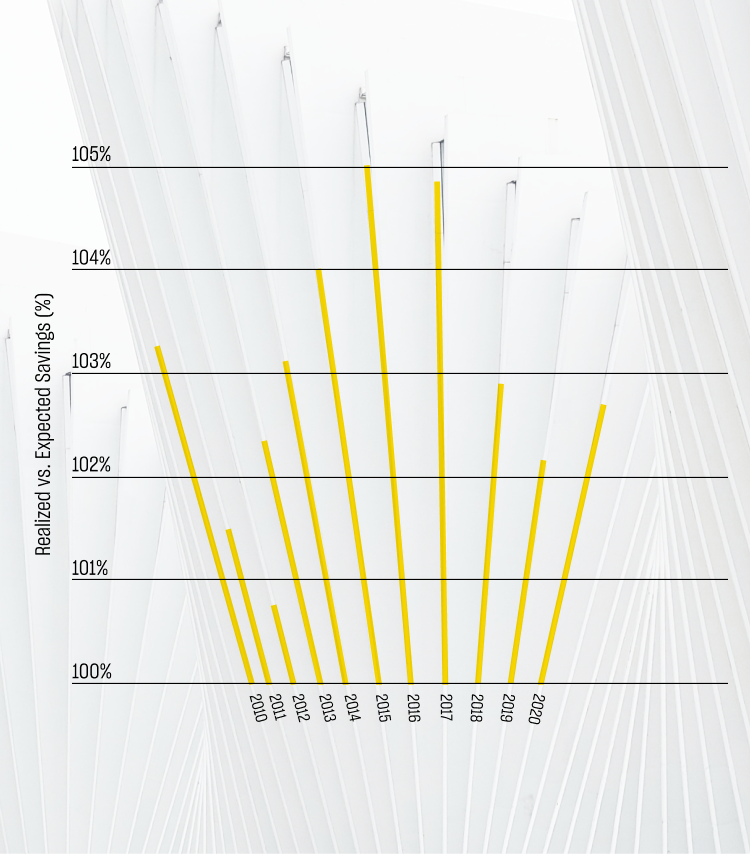
Annual Performance
Ongoing measurement of project performance is central to our SESA. Over the last decade, our realized savings have exceeded the expected savings (as projected in an initial energy audit) each year. On average, our portfolio performs at 103% of its expected savings.2
Our Impact
Environmental performance is interwoven into each of our projects. We prepare annual reports that detail project-level CO2 savings broken out by Scope 1 and Scope 2 emissions to facilitate customer reporting under SBTi.3
Lifetime CO2 Savings Across
Our Portfolio


2020: Annual CO2 Savings


Scope 1
Direct emissions that occur at an organization’s location (e.g., natural gas-fired furnaces, oil-fired boilers, etc.)
Scope 2
Indirect emissions that are generated elsewhere in service to an organization (e.g., purchased or acquired electricity, steam, etc.)


Annual CO2 Savings per $1,000 of Investment
Metrus measures the efficiency of its investments in reducing CO2 (metric tons) by using CarbonCount™ as a scoring tool.6 Higher ratios mean greater carbon reduction per $1,000 of investment.7 The data below represents the average scoring for Metrus projects located within 16 different regional eGrid zones.8 Our investments in the SPNO and MROW zones have the highest CO2 efficiency ratings due in large part to the higher carbon content in the midwestern power grid.


2020: Total Annual Energy Savings
Our projects include a wide range of energy-efficiency improvements that generate both electric and thermal energy savings.9
Queens
University
CarbonCount™ = 0.37

Bristol
Hospital
CarbonCount™ = 0.29

Fortune
100
CarbonCount™ = 0.95
Our Commitment
Our Partnerships

$100 million
The “America Is All In” initiative (formerly “We Are Still In”) is a diverse coalition of U.S. leaders who support halving U.S. emissions by 2030 and reaching net zero emissions by 2050. Metrus is already more than halfway toward its commitment to finance $100 million in sustainable energy projects as part of this ongoing initiative.
$175 million
The Department of Energy’s Better Buildings Challenge is a partnership of businesses, manufacturers, cities, states, universities, and school districts committing to improve the energy efficiency of their buildings by at least 20% over 10 years. Metrus was one of the first financial allies to join this program. After hitting its initial investment commitment, Metrus is 80% of the way to meeting its latest $175 million commitment.
Other Key Partnerships

Diversity, Equity, and Inclusion
Metrus is dedicated to creating a work environment that reflects our commitment to diversity, equity, inclusion, empowerment and anti-racism. We respect and learn from different viewpoints and lived experiences. We welcome, support and benefit from the perspectives of people who differ in race, culture, ethnicity, gender identity, physical ability, religion, and sexual orientation. We believe that having diverse employees, business partners and community relationships is vital to delivering our services and achieving our mission of bringing energy efficiency and clean energy projects to life. At Metrus, diversity of thought and experience is respected and viewed as essential to excellence.
End Notes
- Sites are unique locations that may be incorporated in multiple projects.
- Performance is determined by measured and verified savings using the Efficiency Valuation Organization’s International Performance Measurement and Verification Protocol (IPMVP): https://evo-world.org/en/products-services-mainmenu-en/protocols/ipmvp. Each calendar year may not align with a project’s annual period; therefore savings are weighted between calendar years based on the project’s substantial completion date.
- U.S. Environmental Protection Agency eGRID Scope 1 and 2 Emissions: https://www.epa.gov/greeningepa/greenhouse-gases-epa.
- All conversions into CO2 are based on U.S. EPA eGRID regional emissions data: https://www.epa.gov/egrid.
- U.S. EPA Greenhouse Gas Equivalencies Calculator: https://www.epa.gov/energy/greenhouse-gas-equivalencies-calculator.
- Hannon Armstrong’s CarbonCount™ was used to calculate CO2 (metric tons saved annually) / $1000 invested: https://www.hannonarmstrong.com/esg/carboncount/.
- Each $1,000 investment represents the cost of installing the energy efficiency upgrades in that eGRID region.
- U.S. EPA eGRID regional emissions data: https://www.epa.gov/egrid.
- Savings in 2020 are determined by measured and verified savings using IPMVP when available. Otherwise, expected savings are included. In instances where the calendar year may not align with a project’s annual period, savings are weighted between calendar years based on the project’s substantial completion date.