

2022
Metrus Impact Report
Investing in Energy as a Service
Our Mission
We are leading the way to a sustainable, low-carbon future by bringing energy efficiency and clean energy projects to life.
CEO Message
Bob Hinkle
President & CEO
Dear Stakeholders,
I am pleased to present our third annual Impact Report, which provides energy savings and environmental performance data from 2022 to quantify the real impact of the work we do. This year’s report has been expanded to include Metrus’ own scope 2 and 3 emissions—an extra level of disclosure that is consistent with the mission that inspired the Impact Report in the first place: to spur climate action through greater accountability. As the only Energy as a Service company to produce such a report, Metrus aims to lead by example and demonstrate how increased transparency clarifies the way forward.
Broadly speaking, 2022 gave us much to cheer about, including passage of the Inflation Reduction Act, which committed the U.S. to historic investments in clean energy and energy efficiency. At COP27, I returned to Egypt—where I lived and worked almost two decades ago—and was heartened by the emphasis on energy efficiency evident in several new initiatives and in conversations I had with policymakers and climate leaders. Standardization and disclosure are beginning to find their way into financing protocols in a meaningful way: the White House, for example, announced a rule that would require the largest federal contractors to set Paris Agreement-aligned emissions reduction goals. The momentum behind standardization received a boost with the ISO’s launch of an internationally agreed-upon definition of net zero. In our view, standardization encourages investment by ensuring climate action is measured by science, not ambition.
As the UN’s Intergovernmental Panel on Climate Change (IPCC) made clear in its most recent report, the science regarding current efforts to slow global warming is not encouraging. However, opportunities abound to get back on track, and Metrus is uniquely positioned to help make it happen. Energy efficiency alone can save more than 50% of the GHG emissions needed to hit our national climate goals, and our Energy as a Service model has proven to be an effective way to fund and implement energy efficiency projects that might otherwise not get done. As this report illustrates, our customers achieved meaningful CO2 reductions in 2022—all with no upfront cost.
While disclosure without action won’t move the needle on climate change, we believe that this Impact Report, by providing a 360-degree view of how our business impacts the environment, demonstrates how disclosure can serve as a catalyst for change. Connecting our investments to climate outcomes clarifies the actual value of such investments and encourages more thoughtful, effective, and impactful climate action going forward. Through this expanded Impact Report, Metrus is proud to continue as a leader in that effort.
Thanks,

About This Report
This report is structured to present the performance of the projects in our portfolio through three different lenses, followed by a summary of our commitment to climate action and responsible investing.
Our Portfolio
This section provides details on the number of our project sites, types of energy efficiency measures, and the aggregate portfolio performance relative to expected energy savings and CO2 reduction.
Our Impact
This section details the impact of our projects for customers in terms of lifetime and annual CO2 reductions, annual energy and water savings, and highlights three project case studies.
Our Emissions
This section includes data on Metrus’ own emissions from our business operations and the equipment that we finance and own on behalf of our customers.
Our Portfolio
Metrus has operational Sustainable Energy Services Agreement (SESA) projects in 32 states, encompassing more than 760 sites.1 Our portfolio consists of over 30 different types of energy efficiency measures and technologies.
Energy Efficiency Measures (EEMs) and Technology
Nearly half of our projects feature three or more EEMs, which is consistent with our efforts to bundle upgrades with varying economic and technology profiles to achieve scale. Ninety-seven percent of our projects include lighting, reflecting both its crucial value to customers and its economic importance to unlocking deeper energy retrofits. SESA projects for private sector business, education, and healthcare customers are all represented in the 8+ category. The 19% of our projects with a single EEM are predominantly for warehouse and distribution center clients.
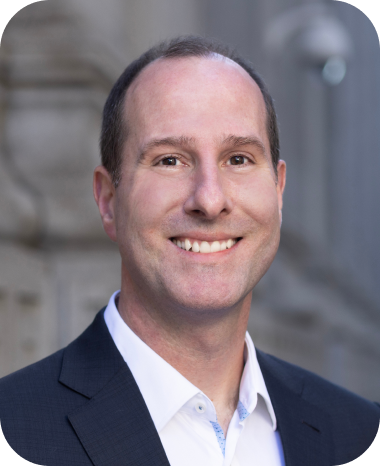
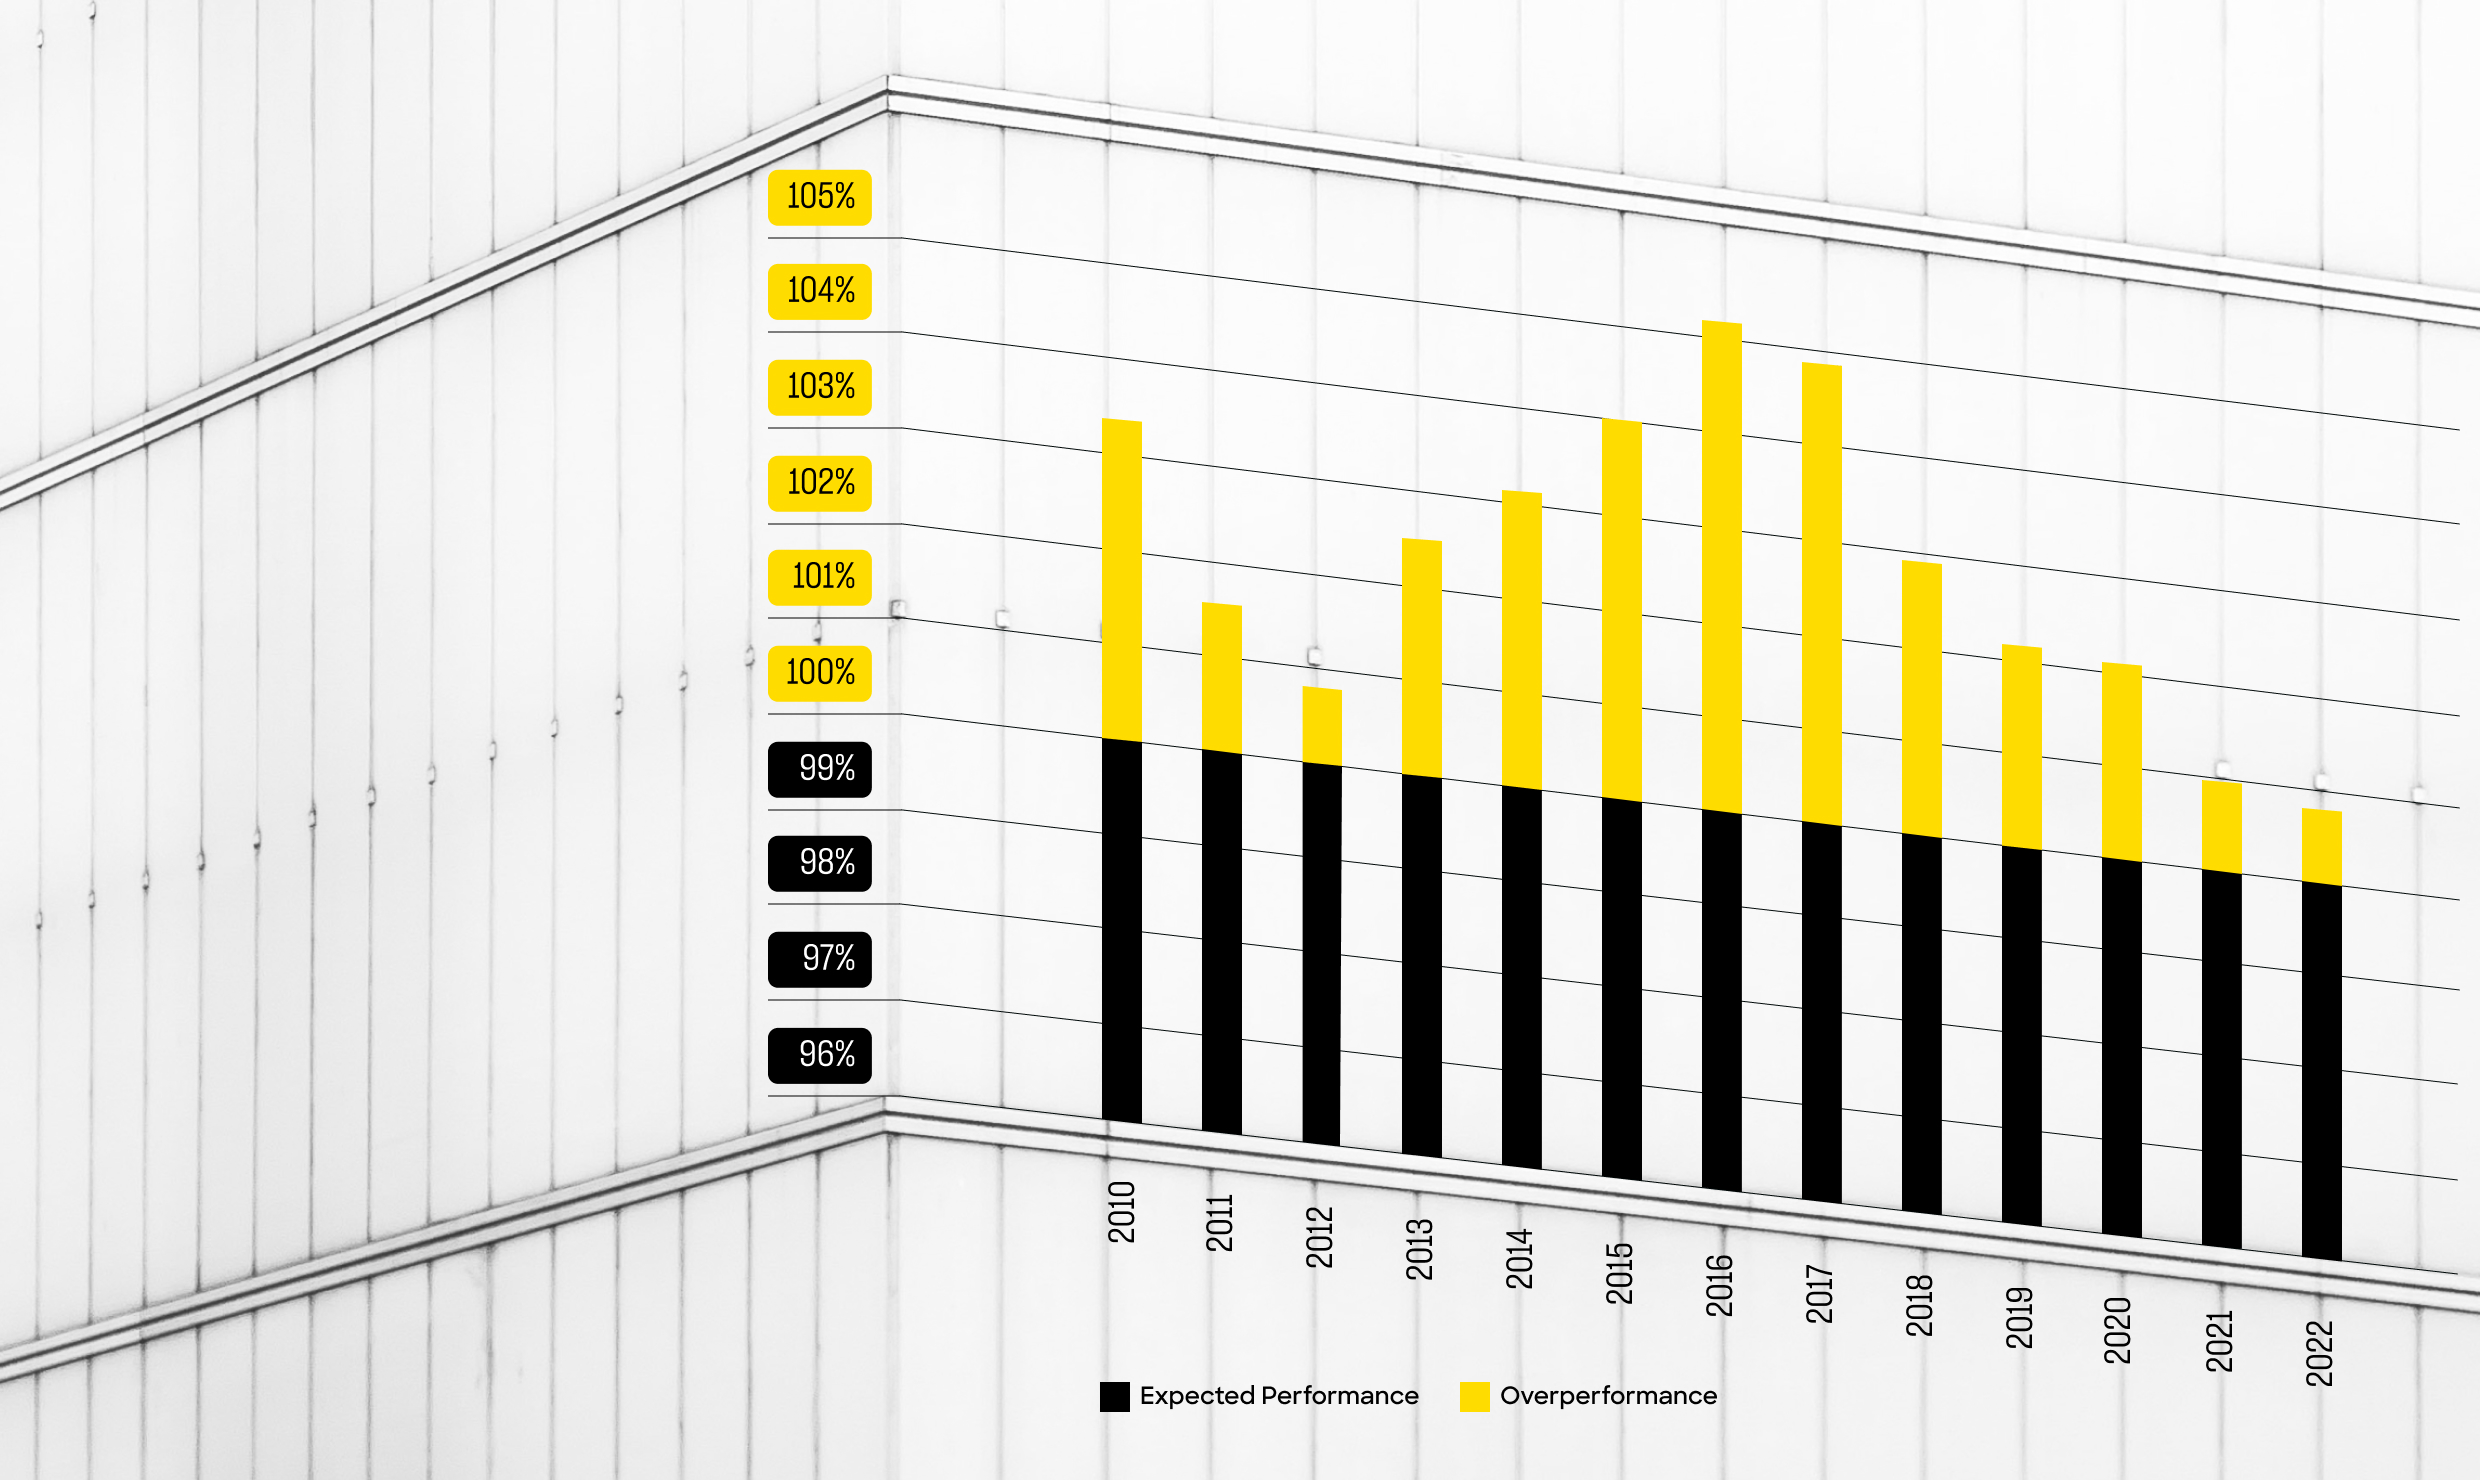
Annual Performance
Over the last decade, our realized savings have exceeded the expected savings (as projected in an initial energy audit) each year. On average, our portfolio performs at 102.1% of its expected savings.2
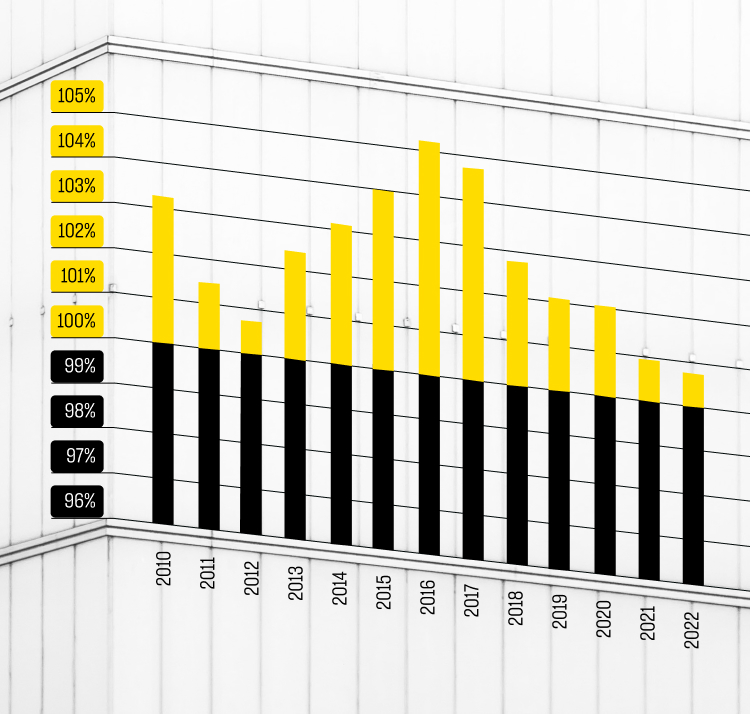
CO2 Savings per $1,000 of Investment
Metrus measures the efficiency of its investment portfolio in reducing CO2 (metric tons) by using CarbonCount™ as a scoring tool.3 Higher ratios mean greater carbon reduction per $1,000 of investment.4 The data below represents the average scoring for Metrus projects located within 19 different regional eGrid zones.5 Our investments in the SPNO and MROW zones have the highest CO2 efficiency ratings due in large part to the higher carbon content in the midwestern power grid.

Our Impact
Environmental performance is interwoven into each of our projects. We prepare annual reports that detail project-level CO2 savings broken out by scope 1 and scope 2 emissions to facilitate customer reporting under SBTi.6
Lifetime CO2 Savings Across
Our Portfolio


2022: Annual CO2 Savings
Scope 1 emissions saved
Direct emissions that occur at an organization’s location (e.g., natural gas-fired furnaces, oil-fired boilers, etc.)
Scope 2 emissions saved
Indirect emissions that are generated elsewhere in service to an organization (e.g., purchased or acquired electricity, steam, etc.)

2022: Total Annual Energy Savings
Our projects include a wide range of energy efficiency improvements that generate both electric and thermal energy savings.10 In 2022, our portfolio saved a total of 1,197,626 MMBtu of energy. That’s equivalent to 206,487 barrels of oil.11
2022: Total Water Savings
According to the EPA, office buildings, hospitals, hotels, and schools, among other commercial and institutional facilities, use 17% of the public water supply, making the sector the 2nd largest consumer in the country.12
Metrus has projects with water efficiency measures across private sector business, higher education, and healthcare customers. Our project with the University of Northwestern Ohio is estimated to save over 7 million gallons of water annually, illustrating how water can be paired with electrical efficiency for a cost-effective upgrade of any facility.
University of
Northwestern
Ohio
CarbonCount™ = 0.31

Bristol
Hospital
CarbonCount™ = 0.29

Daimler Trucks
North America
CarbonCount™ = 0.41

Our Emissions This year’s report takes a holistic look at our overall carbon impact, including Metrus’ own emissions.
While we maintain a low energy profile within our own built environment, we take responsibility for the impact of scope 3 emissions for assets that we own and install on behalf of our customers. Our goal with this report is to provide complete transparency into the energy savings and environmental impact of our business as well as our project investments.
Metrus' Scope 1 Emissions
We don’t generate any direct emissions from fuel combustion.
Metrus' Scope 2 Emissions
For our office space, we purchase utilities that produce emissions.
Metrus' Scope 3 Emissions/Travel
For employee travel and commuting, we generate a nominal amount of emissions.
Metrus' Scope 3 Emissions/Assets
Our project assets consume energy and produce CO2, albeit more minimally than the equipment they replaced.
Total
Our Net CO2 Savings

Our Commitment Metrus is committed to accelerating and scaling climate action by financing, owning, and operating sustainable energy projects.
We were founded over a decade ago for the purpose of providing finance solutions that help companies decarbonize faster, and ultimately be better for the planet. Fourteen years later, we remain steadfast in our mission to drive climate action by championing energy efficiency projects and accelerating the transition to a sustainable, low-carbon future. We’re living at a pivotal time where investment, innovation, and decisive action can help secure a sustainable and energy-efficient future, and we’re fully committed to driving progress and being accountable.
Our Partnerships

$300 million
The Department of Energy’s Better Buildings Challenge is a partnership of businesses, manufacturers, cities, states, universities, and school districts committing to improve the energy efficiency of their buildings by at least 20% over 10 years. Metrus was one of the first financial allies to join this program. After exceeding our first two commitment goals, we’ve recently reupped our target to $300 million.

$200 million
The “America Is All In” initiative (formerly “We Are Still In”) is a diverse coalition of U.S. leaders who support halving U.S. emissions by 2030 and reaching net zero emissions by 2050. As part of this ongoing initiative, Metrus increased its financing commitment from $100 million of sustainable energy projects to $200 million and is now 43% of the way towards its new target.
In 2021, Metrus became a signatory to the internationally-recognized Principles for Responsible Investment (PRI), publicly demonstrating our commitment to responsible investing, at a global level. We join an international cadre of investors and asset owners who believe that an economically efficient, sustainable global financial system is a necessity for long-term value creation.

In 2023, Metrus joined Mission Efficiency in their pursuit to accelerate the transition towards energy-efficient economies worldwide. Mission Efficiency is a collective of actions, commitments, and goals from a coalition of governments, organizations, and initiatives coming together to drive progress on energy efficiency, and Metrus is providing strategic support on key issues in the US.
Other Key Partnerships


Diversity, Equity, and Inclusion
Metrus is dedicated to creating a work environment that reflects our commitment to diversity, equity, inclusion, empowerment, and anti-racism. We respect and learn from different viewpoints and lived experiences. We welcome, support, and benefit from the perspectives of people who differ in race, culture, ethnicity, gender identity, physical ability, religion, and sexual orientation. We believe that having diverse employees, business partners, and community relationships is vital to delivering our services and achieving our mission of bringing energy efficiency and clean energy projects to life. At Metrus, diversity of thought and experience is respected and viewed as essential to excellence.
References
- Sites are unique locations that may be incorporated in multiple projects.
- Performance is determined by measured and verified savings using Efficiency Valuation Organization International Performance Measurement and Verification Protocol (IPMVP): https://evo-world.org/en/products-services-mainmenu-en/protocols/ipmvp. Each calendar year may not align with a project’s annual period; therefore savings are weighted between calendar years based on the project’s substantial completion date…
- Hannon Armstrong’s CarbonCount™ was used to calculate CO2 (metric tons saved annually) / $1,000 invested: https://www.hannonarmstrong.com/esg/carboncount/.
- Each $1,000 investment represents the cost of installing the energy efficiency upgrades in that eGRID region.
- U.S. Environmental Protection Agency eGRID regional emissions data: https://www.epa.gov/egrid/power-profiler#/.
- U.S. EPA eGRID Scope 1 and 2 Emissions: https://www.epa.gov/greeningepa/greenhouse-gases-epa.
- All conversions into CO2 are based on U.S. EPA eGRID regional emission data: https://www.epa.gov/egrid/power-profiler#/.
- U.S. EPA Greenhouse Gas Equivalencies Calculator: https://www.epa.gov/energy/greenhouse-gas-equivalencies-calculator.
- This total includes 21,826 metric tons of avoided CO2 through assets that Metrus has financed but does not own.
- Savings in 2022 are determined by measured and verified savings using IPMVP when available. Otherwise, expected savings are included. In instances where the calendar year may not align with a project’s annual period, savings are weighted between calendar years based on the project’s substantial completion date.
- Electricity, natural gas, and fuel oil savings were individually converted to MMBtu, and total MMBTU was converted to equivalent barrels of oil using data from the U.S. EPA: https://www.epa.gov/energy/greenhouse-gases-equivalencies-calculator-calculations-and-references#oil.
- U.S. EPA WaterSense: https://www.epa.gov/watersense/types-facilities.